


Abstract
Background: There is much evidence for the influence of low socio-economic status on poor health. It is, however, also important to study the ways in which people attain and retain their socio-economic status and the factors that predict changes in socio-economic status, such as a decrease in income. Such mobility also occurs in older populations, in which financial and health-related changes are very common, especially after retirement. Methods: Three years of follow-up data from 1443 Dutch men and women aged 55 years and older who participated in the Study on Medical Information and Lifestyles Eindhoven (SMILE) were gathered. Logistic regression analyses were used to study the independent effects of physical and mental dysfunction and severity of chronic diseases and adverse personality factors on decrease in income. Results: Social anxiety (OR = 1.62, 95% CI: 1.09–2.40), physical dysfunction (OR = 1.71, 95% CI: 1.07–2.74) and severe diseases (OR = 1.37, 95% CI: 1.05–1.78) were significant predictors of decrease in income. These contributions were independent of each other, and remained robust after controlling for other confounding factors, such as gender, age and educational level and change in employment status. Mental dysfunction and other personality characteristics, such as hostility and mastery, did not contribute to decrease in income. Conclusion: Social anxiety and poor physical health are relevant factors associated with decrease in income in old age. The findings suggest that these factors are important in retaining one's socio-economic status. Future longitudinal research is necessary to further disentangle the mechanisms and pathways related to socio-economic health inequalities along the life-course.
Introduction
Adverse socio-economic circumstances are related to disease and health-related dysfunction. For example, income inequalities are important determinants of population health1,2. Furthermore, lower socio-economic status (SES) is also related to adverse personality characteristics. Lachman and Weaver,3 for example, showed that persons with lower income had lower perceived mastery and control.
For scientific purposes and to set up interventions to reduce socio-economic health differences, it is also important to examine the possibility of reverse associations and to study the factors that predict changes in SES, such as a decrease in income. Such mobility also occurs in older populations, in which financial and health-related changes are very common, especially after retirement.
It has been proposed that people with initially poorer health are more likely to attain lower educational and occupational positions4 and to move downward in income5. For example, in the Dutch GLOBE study, it was shown that childhood poor health determined downward socio-economic mobility in adulthood.6
Adverse personality characteristics, such as mastery and control beliefs may also be related to socio-economic attainment and socio-economic mobility.7 Osborne8 found that women with low control beliefs have lower incomes than women with high control beliefs. Furthermore, Wang and colleagues9 found that high control beliefs had stronger positive effects on later educational and occupational attainment than both the educational level of the parents and the level of intelligence. Other personality factors, such as social anxiety and neuroticism may also be associated with career success, for example when applying for jobs or social benefits.
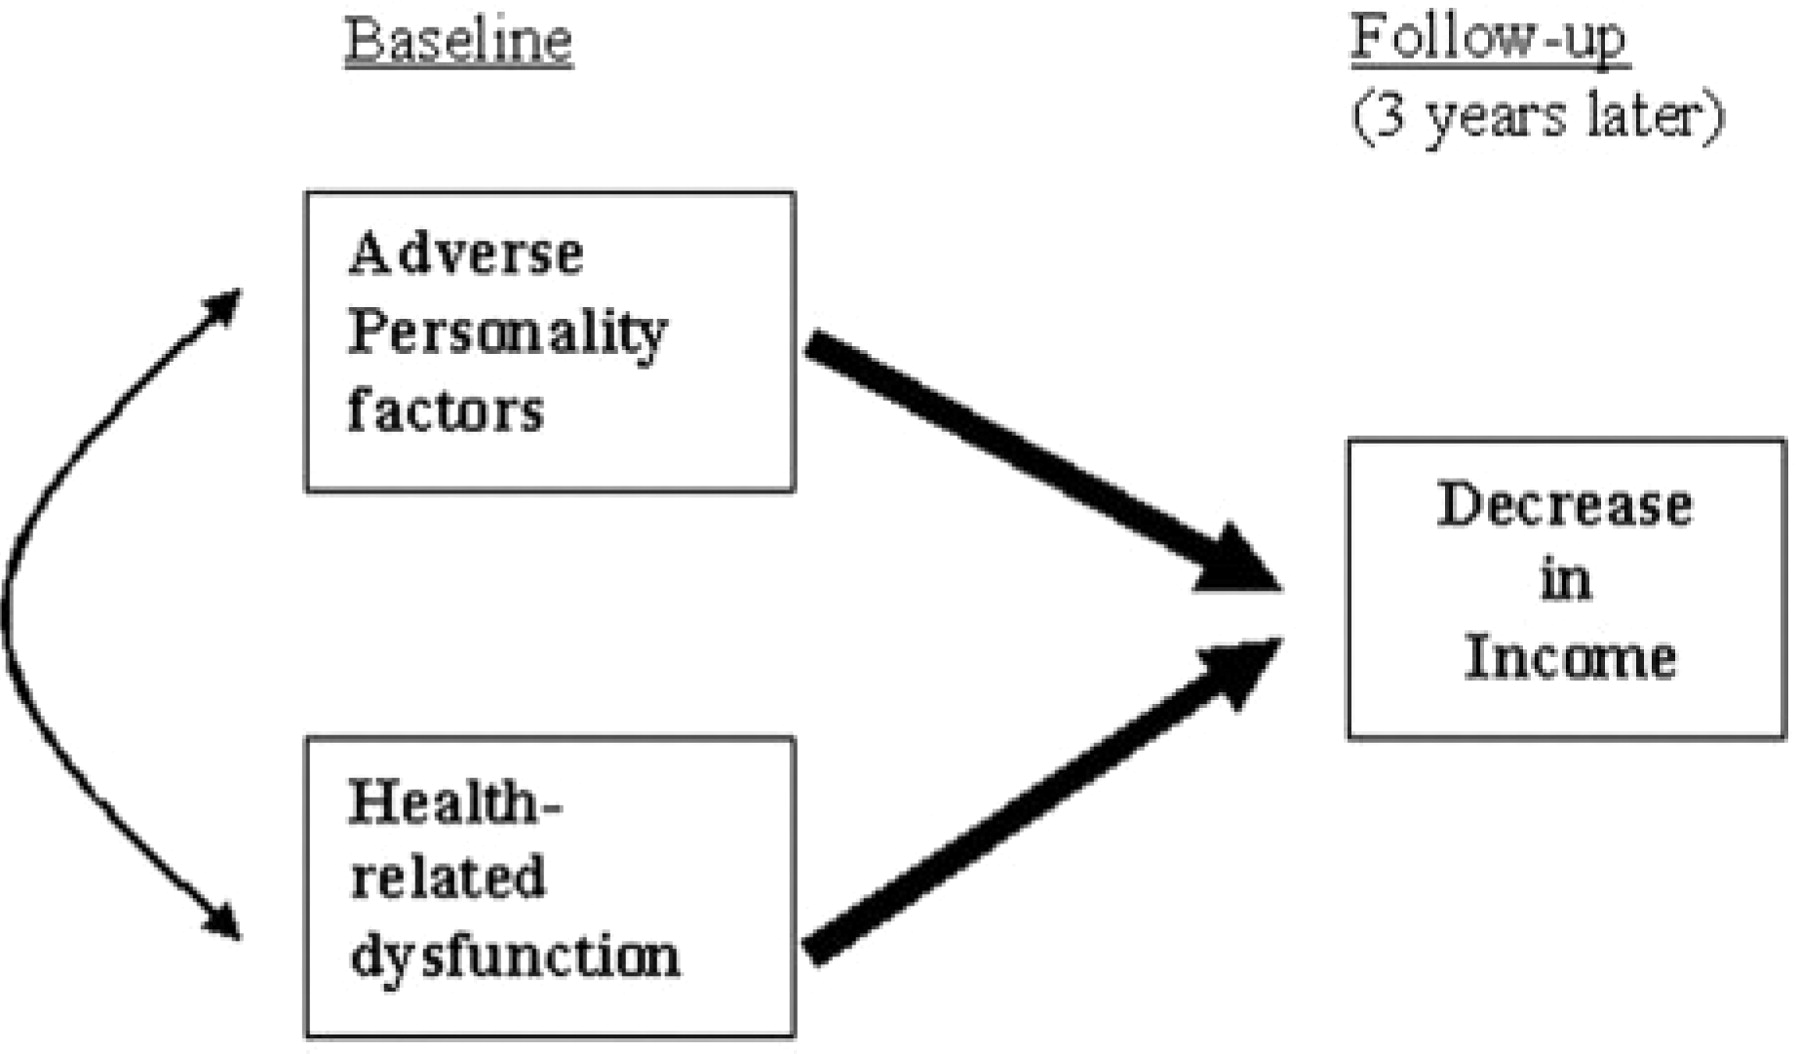
To our knowledge, the role of health and personality as predictors of income change in old age have not been studied before. Using 3 years of follow-up data from the longitudinal SMILE study among Dutch men and women of 55 years or older, we set out to examine whether, in older persons, adverse personality characteristics and poor initial health-related functioning and disease are independent predictors of decrease in income. A simplified model of the relationships under study is shown in figure 1. The potential reciprocal relation between personality and health will explicitly be addressed by both controlling for, and discussing its confounding influence.

Hypothetical model, personality and health-related function as predictors of income decrease
Methods
Design
Data came from the longitudinal SMILE study (i.e. Study on Medical Information and Lifestyles Eindhoven).10 SMILE is a dynamic cohort, meaning that new participants will enter the population sample when they either reach the age of inclusion or when they are enrolled as a new patient in one of the nine participating centres and give informed consent. Respondents may leave the population either through leaving the participating centres or due to death or drop-out.10 Persons aged 55 years and older are considered as a separate population within SMILE.11 The present study uses data that were collected between May 2003 and May 2006.
Study population
In May 2003, 9557 persons of 55 years or older were sent self-administered questionnaires, of whom 4745 (50%) responded. Fifty-seven percent (N = 2705) were followed-up until May 2006. After exclusion of persons that had missing scores on variables of interest, the main analyses consisted of 1443 persons (53%) (753 men and 690 women; mean age 68.9, SD = 8.5). Largest numbers of missing values were found for income (33%) and health-related function (15%). Persons from low socio-economic status groups and with health-related dysfunction participated somewhat less in this study. Potential biases from non-response and attrition will be addressed in the Discussion section.
Measures
Income change
Income was measured in May 2003 and May 2006, using 11 ordinal categories ranging from <750 Euro to >3000 Euro Net. The midpoint of each category was chosen to create a pseudo-interval variable. To adjust for the number of persons who had to live from the household income, we divided both household income variables by an equivalence factor. To calculate this equivalence factor, we used the following formula: 1 (the first adult) +0.5* the number of extra adults that had to live from the household income + 0.3* the number of children below the age of 18 that had to live from the household income.12 Next, income at the 2003 baseline was adjusted for inflation (+5.1%), allowing a comparison with income levels in 2006. For the logistic regression analyses, the difference between income in 2006 and income in 2003 was calculated and the outcome was dichotomised (i.e. decrease versus no decrease). Alternative outcomes, using wider or more stringent cut-off scores, were calculated as well.
Personality
Personality was measured using different scales in May 2003 and May 2004.
Social anxiety was measured by the social inadequacy subscale of the ‘Dutch Personality Questionnaire’ (DPQ) (15 items; range: 0–30; Cronbach's α = 0.87). One of the items is: ‘I feel uncomfortable talking to strangers’.13,Social dominance (17 items; range: 0–34; Cronbach's α = 0.77) was also assessed by a subscale of the DPQ. One of the items is: ‘I dislike people who can’t make decisions’. Both social anxiety and social dominance were measured in May 2004. Neuroticism (12 items; range 0–12; Cronbach's α = 0.85) was measured in May 2003 using the Dutch version of the Eysenck Personality Questionnaire.14,15 One of the items is: ‘Do you consider yourself a worrier?’. Hostility (eight items; range: 8–40; Cronbach's α = 0.77) was measured in May 2004 using a subscale of the Dutch version of the aggression questionnaire.16–18 One of the items is: ‘I sometimes feel that people are laughing at me behind my back’. The Dutch version of Pearlin and Schooler's Mastery scale (seven items; range 7–35; Cronbach's α = 0.83) was used to measure the extent to which people belief that their behaviour matters for the events that occur in their environment in May 2003.19,20 One of the items is: ‘Sometimes I feel that I am being pushed around in life’. For the purpose of this study, personality measures were dichotomised, defining the 10% worst scorers as having adverse personality characteristics (i.e. high levels of social anxiety, social dominance, neuroticism and hostility respectively, and low levels of mastery).
Health-related function and disease
Data about mental and physical function were derived from the Dutch version of the MOS SF36,21,22 assessed in May 2003. Physical and mental dysfunction was defined as having a score below the 10th percentile (scores of ≤29 and ≤36 out of a range from 10 to 70, respectively). Respondents were further asked whether or not they had any of the severe (chronic obstructive pulmonary disease, heart disease, bowel disease, liver disease, kidney disease, diabetes, cancer, epilepsy and stroke) and less severe (migraine, joints, rheumatoid arthritis, arthrosis, back, injury and other) chronic diseases.23 Presence of diseases was also measured in May 2003.
Potential confounders
Covariates were age, gender, educational level and change in employment status. Education, as an indicator of prior (and current) socio-economic influences, was measured in May 2003, using a seven-point scale. Three categories were then created in a way that each group contained approximately a third of the sample: primary school only (lowest); lower vocational education and intermediate general education (middle); intermediate vocational education, higher general education, higher vocational education and university (highest). Change in employment status was defined as a change in employment status between 2003 and 2006, for example due to retirement or discharge.
Statistical analyses
First, Chi-squared tests, based on cross-tabulations, were computed to examine potential gender, age and educational differences in decrease in income, prevalence of adverse personality and health-related dysfunction and disease. Second, multiple logistic regression models were fitted to examine whether personality factors were related to a decrease in income between 2003 and 2006. The first model was adjusted for age, gender, education, change in employment status and inflation corrected income at the 2003 baseline measurement. The second model was additionally adjusted for health-related dysfunction and disease. Similarly, logistic regression models were fitted to examine whether health-related function and the prevalence of diseases were related to a decrease in income. Analyses were adjusted for age, gender, education, change in employment status and income at baseline (Model 1) and additionally for adverse personality factors. To test the robustness of the findings, all analyses were repeated with continuous scoring, using linear regression analyses. Moreover, analyses were performed for different subgroups, i.e. younger (55–65 years) and older (>65 years) persons, male and female, persons with and without chronic diseases and persons with high or low education. All statistical analyses were performed using SPSS 15.0.1.
Results
Table 1 shows that persons above the age of 75 years were significantly more likely to report a decrease in income between 2003 and 2006. These older persons were also more likely to report social anxiety and low mastery. Furthermore, women were more likely to report an income change. Moreover, they were significantly more likely to report low mastery, high neuroticism and to report mental dysfunction and less severe diseases. Men were more likely to report a negative change in employment status and high social dominance levels. Finally, persons with a lower educational level did not have higher probabilities of reporting a decrease in income, and were even significantly less likely to report a change in employment status. However, these persons were significantly more likely to report high levels of adverse personality characteristics and to suffer from physical and mental dysfunction.
Percentages of people with a decrease in income after 3 years of follow-up, negative psychosocial characteristics and health-related dysfunction by age, gender and educational level at baseline and change in employment status between 2003 and 2006a
| Included | Age | Gender | Educational level | Excluded | ||||||
|---|---|---|---|---|---|---|---|---|---|---|
| Total N = 1443 | 55–64 N = 610 | 65–74 N = 586 | ≥75 N = 247 | M N = 753 | F N = 690 | L N = 187 | M N = 551 | H N = 705 | Lost to f.u. N = 2040 | |
| Income change | ||||||||||
| Decrease | 35.6 | 36.6 | 27.6 | 51.8 | 34.3 | 37.0 | 35.8 | 33.4 | 37.2 | – |
| Employment status | ||||||||||
| Changed 2003–06 | 7.2 | 14.9 | 2.2 | 0 | 8.0 | 6.4 | 4.3 | 5.6 | 9.2 | – |
| Adverse personality | ||||||||||
| Social anxiety | 8.6 | 7.7 | 8.2 | 11.7 | 8.0 | 9.3 | 17.6 | 7.8 | 6.8 | 11.8 |
| Low mastery | 6.3 | 6.1 | 6.6 | 7.7 | 4.4 | 8.4 | 8.6 | 8.0 | 4.4 | 15.6 |
| Hostility | 9.5 | 10.3 | 8.7 | 9.3 | 10.1 | 8.8 | 13.9 | 12.2 | 6.2 | 14.8 |
| Social dominance | 13.6 | 13.3 | 13.8 | 13.8 | 19.7 | 7.0 | 4.8 | 10.0 | 18.7 | 11.9 |
| Neuroticism | 7.7 | 8.4 | 7.8 | 5.7 | 5.7 | 9.9 | 9.6 | 10.9 | 4.7 | 12.9 |
| Disease and dysfunction | ||||||||||
| Physical dysfunction | 6.4 | 5.2 | 6.5 | 8.9 | 5.4 | 7.4 | 9.1 | 7.8 | 4.5 | 14.2 |
| Mental dysfunction | 7.5 | 7.9 | 7.0 | 7.7 | 5.6 | 9.6 | 13.4 | 7.6 | 5.8 | 13.3 |
| ≥Disease (any) | 55.6 | 53.9 | 56.7 | 57.5 | 54.1 | 57.4 | 56.1 | 57.5 | 54.0 | 52.0 |
| ≥Severe disease | 23.4 | 20.2 | 23.7 | 30.8 | 21.6 | 22.2 | 26.7 | 24.5 | 21.7 | 27.6 |
| ≥Less severe disease | 44.1 | 42.6 | 46.1 | 43.3 | 41.4 | 47.1 | 45.5 | 45.6 | 42.7 | 39.9 |
a: Results in bold indicate a significant (P < 0.05) difference
Table 2 shows how adverse personality and disease and dysfunction are related to decrease in income between 2003 and 2006. Persons who reported to have high levels of social anxiety had a 1.69 (95% CI: 1.15–2.50) times higher odds of a decrease in income compared with persons who did not report high social anxiety. The significance of this association even held after additional adjustment for physical and mental dysfunction and diseases (OR = 1.62; 95% CI: 1.09–2.40). Other adverse personality characteristics, although consistently having negative cross-sectional associations with income, were not significantly related to a decrease in income. Similar to social anxiety, physical dysfunction was strongly related to income decrease (OR = 1.67; 95% CI: 1.06–2.61). When adjusting for adverse personality factors, the association remained statistically significant (OR = 1.71; 95% CI: 1.07–2.74). In addition, the prevalence of one or more severe diseases at baseline was also significantly related to decrease in income, even when adjusted for adverse personality factors (OR = 1.37; 95% CI: 1.05–1.78). Although consistently in the predicted direction, mental dysfunction and less severe diseases were not significantly related to a decrease in income.
Adjusted ORs of decrease in income (2003–06) by adverse personality and disease and health-related dysfunction (n = 1443)
| Model 1a OR (95% CI) | Model 2b OR (95% CI) | |
|---|---|---|
| Adverse personality | ||
| Social anxiety | 1.69 (1.15–2.50) | 1.62 (1.09–2.40) |
| Mastery | 1.14 (0.72–1.81) | 0.88 (0.52–1.48) |
| Hostility | 1.09 (0.74–1.61) | 1.00 (0.67–1.49) |
| Social dominance | 1.05 (0.76–1.46) | 1.05 (0.75–1.46) |
| Neuroticism | 1.21 (0.79–1.84) | 1.07 (0.67–1.69) |
| Disease and dysfunction | ||
| Physical dysfunction | 1.67 (1.06–2.61) | 1.71 (1.07–2.74) |
| Mental dysfunction | 1.25 (0.81–1.90) | 1.20 (0.74–1.94) |
| ≥1 Disease (any) | 1.10 (0.88–1.38) | 1.08 (0.86–1.36) |
| ≥1 Severe disease | 1.41 (1.08–1.83) | 1.37 (1.05–1.78) |
| ≥1 Less severe disease | 1.09 (0.87–1.36) | 1.06 (0.85–1.34) |
a: Model 1 is adjusted for gender, age, educational level, inflation corrected income 2003 and change in employment status
b: For the analyses that examine the role of adverse personality, Model 2 is additionally adjusted for physical and mental dysfunction and diseases. For the analyses that examine the role of disease and dysfunction, Model 2 is additionally adjusted for adverse personality factors
Effects were similar in men and women, diseased and non-diseased, and in the younger (≤65 years) and older (>65 years) age groups; the respective interaction terms were not significant in our analyses (not tabulated). Social anxiety was also similarly related to decrease in income in low and high educated persons and in persons with high and low income levels at baseline: the respective interaction term was not significant (P = 0.68). Similarly, additional analyses were performed, using wider cut-off points for income decrease (e.g. based upon reliable change analyses where an income drop is defined by drops larger than 0.5* 1 SD of the income decrease or based upon alternative more stringent cut-offs, such as a >5% decrease or a >€50 decreases) and also using the continuous income levels in 2006, adjusted for income in 2003 (with linear regression/ANCOVA). The pattern of results was comparable in all analyses, showing similar regression coefficients and significance levels. Moreover, findings were similar with and without correction for inflation.
Discussion
This prospective study intended to clarify the role of adverse personality characteristics and disease and health-related dysfunction in the explanation of decrease in income among older persons. The results showed that prior physical dysfunction and severe disease, as well as social anxiety were independent predictors of decrease in income in 3 years of follow-up.
How should these findings be interpreted? With regard to social anxiety, it is likely that the persons reporting higher social anxiety levels were the ones less likely and less able to take up opportunities to retain similar income levels, for example by applying for additional social benefits. Social anxiety or social inadequacy,24 as well as related concepts, such as shyness, introversion and neuroticism15 might reflect beliefs of low control in social circumstances. Consequently, persons with these adverse personality characteristics are less likely to engage in activities, which expand their pool of material, social and cultural resources; this may limit their educational and occupational achievements25 and—as we show in the present study—probably also heightens their risk of decrease in income.
From a sociological perspective, the effects of health on socio-economic attainment might involve stigma and social discrimination against the ill and disabled. Due to this discrimination, it is argued that ill and disabled individuals are deprived of the same job opportunities and the accompanying material and psychosocial benefits.26 For example, Van de Mheen and colleagues27 presented higher risks of health-related mobility out of employment (i.e. disability pension or early retirement) with a corresponding decrease in income of ill persons.
As the prior health condition and personality might not only be related to decrease in income, but also to later health outcomes,28 our findings also relate to the ‘selection’ or ‘reversed causation’ hypothesis regarding socio-economic health inequalities.5,7,26,29,30 The ‘direct selection hypothesis’ proposes that a person's health is related to where people end up in socio-economic terms. The ‘indirect selection hypothesis’ postulates that some other quality of the individual, e.g. personality, affects where one ends up in terms of both socio-economic status and health.7,26,29,30 Although social anxiety was related to income decrease in our study, there was only little association between social anxiety and health in 2003, as the odds ratio of income decrease for social anxiety hardly decreased when the health indicators were controlled for (table 2). Preliminary longitudinal findings, however, indicated that social anxiety in 2003 was related to changes in the health indicators thereafter (not tabulated), suggesting a role of anxiety in indirect selection processes. This corroborates recent work of others.30 For example, the GAZEL study found that a substantial part of the socio-economic differences in mortality were based on adverse personality characteristics.30 SES and personality were, however, not measured at the same measurement phase, making it difficult to ascertain the causal nature of the association between personality and SES.30
Although, in our study all adverse personality characteristics were related to a subsequent decrease in income, only social anxiety was a statistically significant predictor. Social anxiety has been discussed as an important psychological pathway through which income inequality affects health.31 In our study, the opposite causal ordering from anxiety to income is supported by the adjustment not only for baseline income level, but also for educational level. The trait component of personality has been shown to be remarkably stable over the adult life span.32 The stability of social anxiety is further supported by the supposedly trait-like measurement of social anxiety by the Dutch Personality Questionnaire.13 Moreover, evidence exists that social anxiety-related personality characteristics are, to at least some extent, hereditary, as is the case with several other personality characteristics.33,34
If social anxiety and other aspects of personality are fundamental determinants of socio-economic attainment and future health and health behaviour, the task of reducing health inequalities may, however, be further complicated, depending on the amenability to change the relevant aspects of personality. To even more fully determine the contribution of personality factors and health in the life-course of older persons, advanced modelling of lagged repeated measures of health, socio-economic status and personality over longer periods of time is needed.35
Methodological considerations
Several methodological limitations may affect the interpretation of the results of our study. First, our study relied solely on self-reports which might have introduced measurement error.36 In the form of negative affectivity (tendency to complain),37 this may have led to an overestimation of associations. Because of the prospective design of this study and the repeated measurement of income, we consider this problem minimal. Undoubtedly, the crude categorical measurement of income (chosen to increase response on the income question) and the open end highest category introduced at least some measurement error. Furthermore, changes that remain within the highest category (>3000 Euro) are not picked up by our method. Moreover, persons on the lower end of the income ladder might show less income decrease because of additional social benefits. Another problem related to the measurement of income might be ‘regression to the mean’.38 This problem is highest when outcome measures are poorly correlated.38 Our analyses show that income level in 2003 and in 2006 are moderately correlated (Spearman's rho: 0.67, P < 0.01), indicating that regression to the mean is not likely to be a substantial problem. Furthermore, it is reassuring that interactions with income level at baseline and, for example, social anxiety, are not significant, indicating similar prediction at the high and low end of the income measure. Additional analyses, using wider cut-off points for income decrease or using continuous income levels in 2006 showed comparable results.
Second, response analyses showed that men and persons from the youngest (<65 years) age groups were more likely to respond. Moreover, attrition (between May 2003 and May 2006, 43% were lost to follow-up) was higher for persons who were lower educated or had lower income levels at baseline. Table 1 shows that persons who were lost to follow-up were also more likely to report adverse personality characteristics and reported worse physical and mental function scores at baseline. Missing values analyses (not tabulated) revealed that persons with missing scores on the baseline income measurement were significantly more likely to be lower educated (26% is lower educated, compared with 15% in responders). Moreover, persons that were excluded due to missing values on any of the variables of interest were more likely to report adverse personality characteristics and more often report poor physical function. This pattern of selective response and attrition may have led to an underestimation of the reported associations.
Conclusion
Social anxiety and poor physical health are relevant factors associated with decrease in income in old age. The findings suggest that these factors are important for socio-economic mobility in elderly persons. Future longitudinal research is necessary to further disentangle the additional mechanisms and pathways related to socio-economic health inequalities along the whole life-course.
Acknowledgements
The longitudinal SMILE study is carried out by the Department of General Practice of Maastricht University, in collaboration with the Eindhoven Corporation of Primary Care Centres. The researchers are indebted to the participants for their willingness to participate in the study.
Conflicts of interest: None declared.
Recently, there is renewed interest in studies looking at the factors that predict changes in socio-economic status, such as decrease in income.
This study showed that adverse personality, in particular social anxiety and poor physical health are relevant determinants of decrease in income in old age.
The findings suggest that selection mechanisms may be important in the explanation and thus also the prevention of decrease in income and potentially socio-economic inequalities in health.

Comments